

Ripple’s XRP appears to be gearing up for a potential breakout after forming a bullish flag pattern on the daily chart. This setup could potentially increase the token by 15% in the short term.
On-chain data supports traders’ optimism. However, caution is required in the short term. Key technical indicators point to a possible short-term decline before the next significant rally.
Sponsored Sponsored
XRP bullish flag suggests 15% rise
A bullish flag pattern is emerging on the daily chart of XRP/USD. The altcoin has attempted to close above the upper bound on the “flag-like” side of this pattern multiple times over the past six trading sessions, confirming the underlying bullish strength.
For more token TA and market updates: Want more token insights like this? Sign up for editor Harsh Notariya’s daily crypto newsletter here.
This pattern forms when a strong price increase is followed by a period of consolidation, resembling a downward or sideways “flag.” This indicates that the asset is temporarily pausing before the uptrend is likely to resume.
A breakout above the flag’s upper line usually confirms this pattern and often triggers an uptrend that mirrors the previous flagpole height. This could push XRP up 15% towards $3.45. If demand strengthens at this point, the altcoin could rise towards $4 and reach new highs.
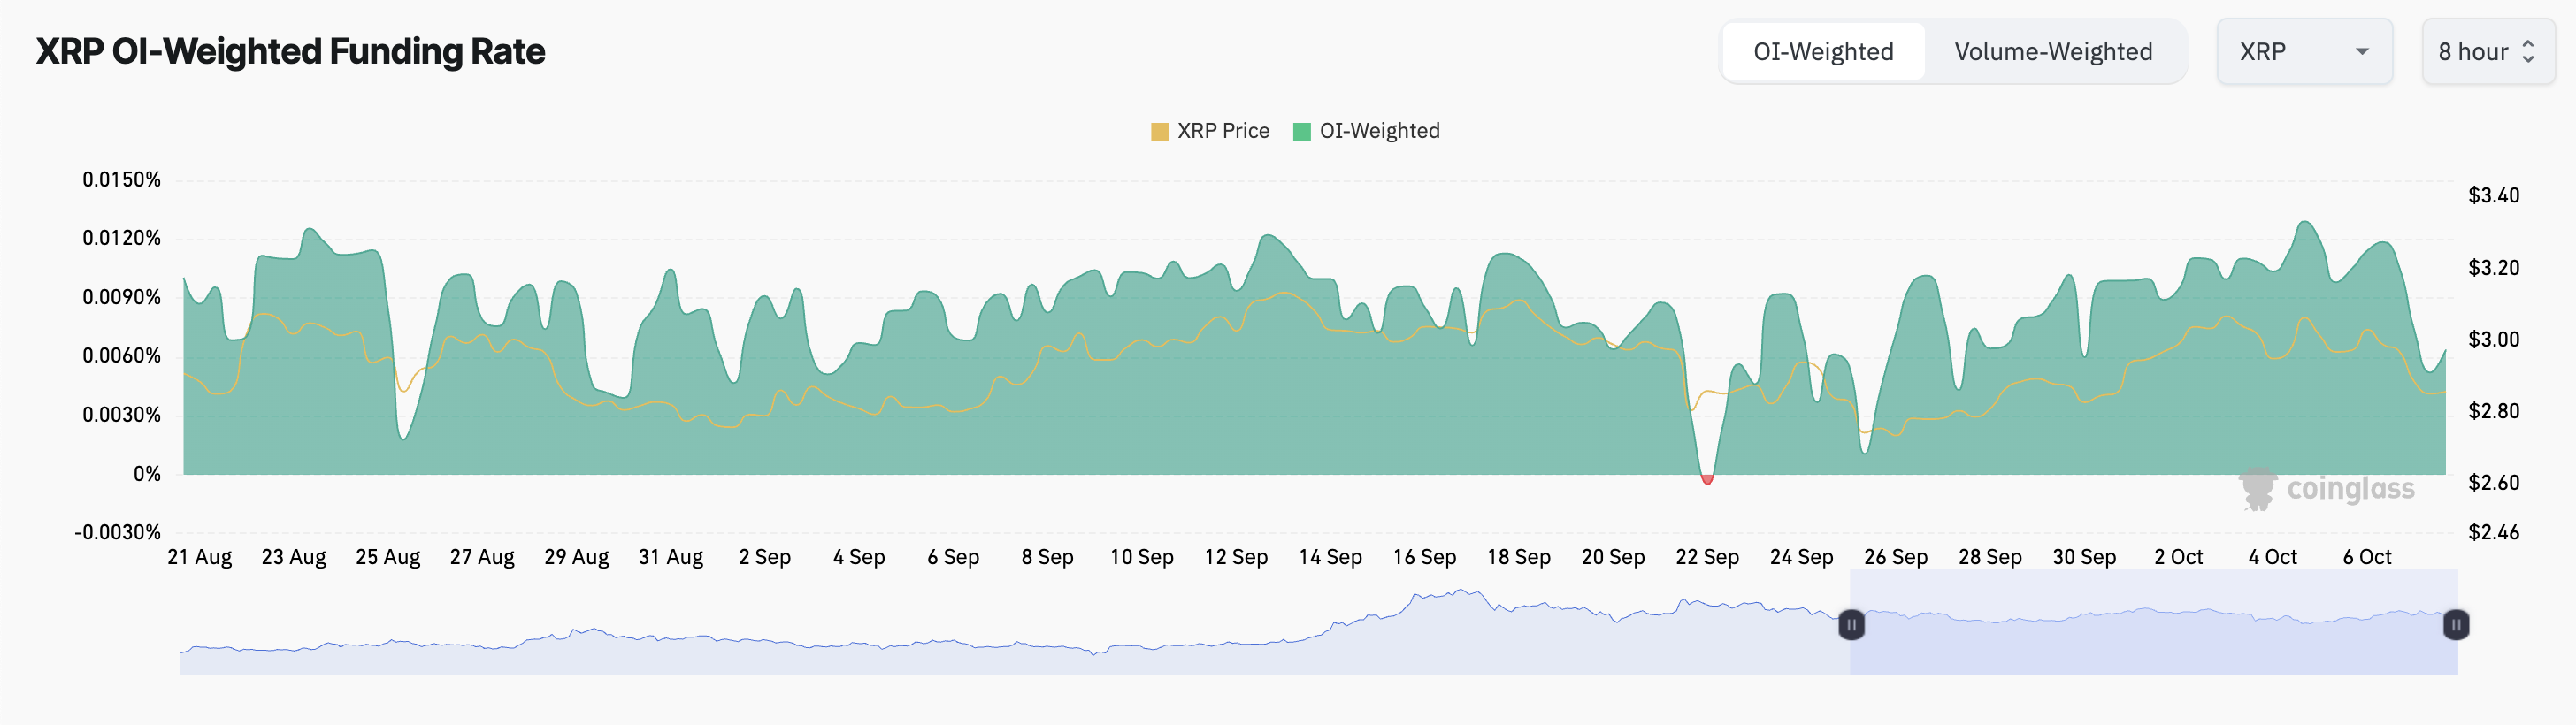
Moreover, XRP’s funding rate in the derivatives market remains positive. This means that most traders are taking positions aiming for further upside. As of this writing, this is 0.0064%, according to Coinglass.
Sponsored Sponsored
The funding rate is a periodic payment exchanged between long and short traders in the perpetual futures market to fix the contract price at the spot price. When interest rates are positive, demand for longs exceeds shorts. This is a clear signal that market sentiment is leaning bullish.
Sustained positive funding rates like XRP demonstrate strong market confidence in the asset’s price potential.
XRP Rise May Stall Due to Bearish Crossover Form
If XRP’s bullish flag pattern plays out as expected and the token successfully breaks through the upper flag line, the price could rise towards $3.45 in the medium term.
However, you need to be careful during that time. XRP’s Moving Average Convergence Divergence (MACD) measurement shows that XRP is forming a bearish crossover, suggesting the altcoin may experience a temporary decline before the next potential surge.
A bearish crossover is formed when an asset’s MACD line (blue) attempts to fall below the signal line (orange). Historically, this pattern signals the beginning of a downturn. This indicates that buying pressure may be weakening and sellers may start to take control.
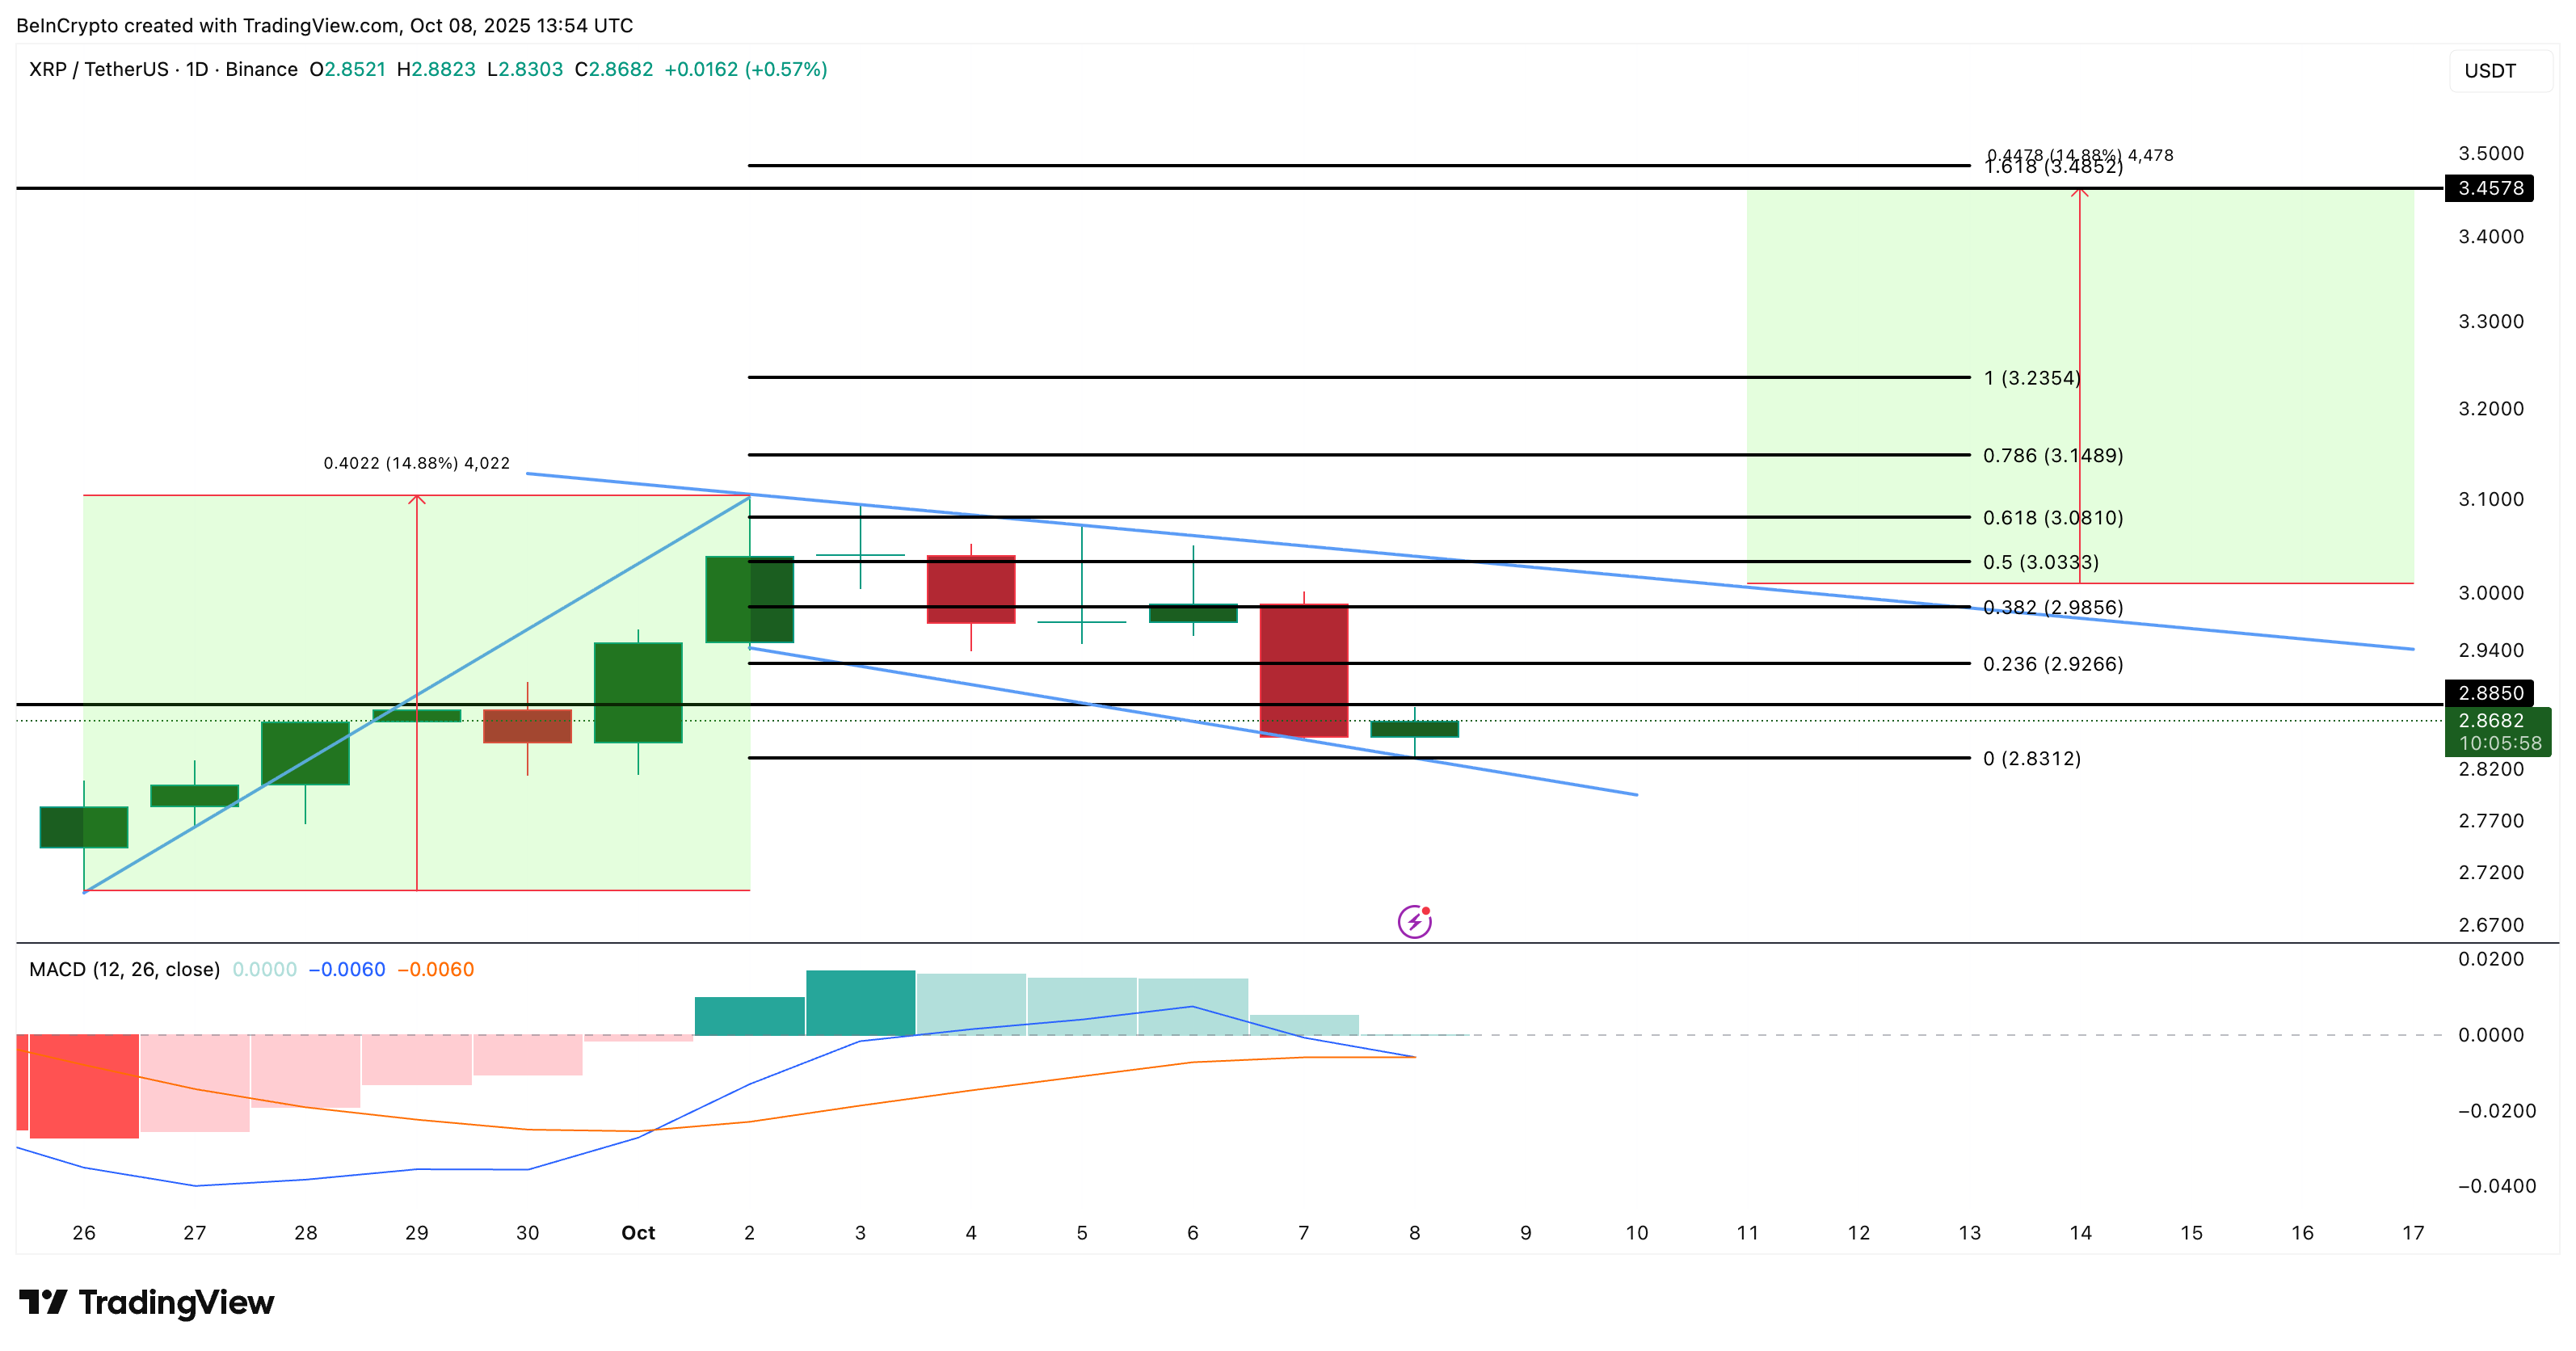
If this bearish momentum continues, XRP price could retreat towards the flag support level near $2.83.